Cloud Environment
Monitoring Tools for KubeStellar (Prometheus, Grafana and Node Exporter)#
Description#
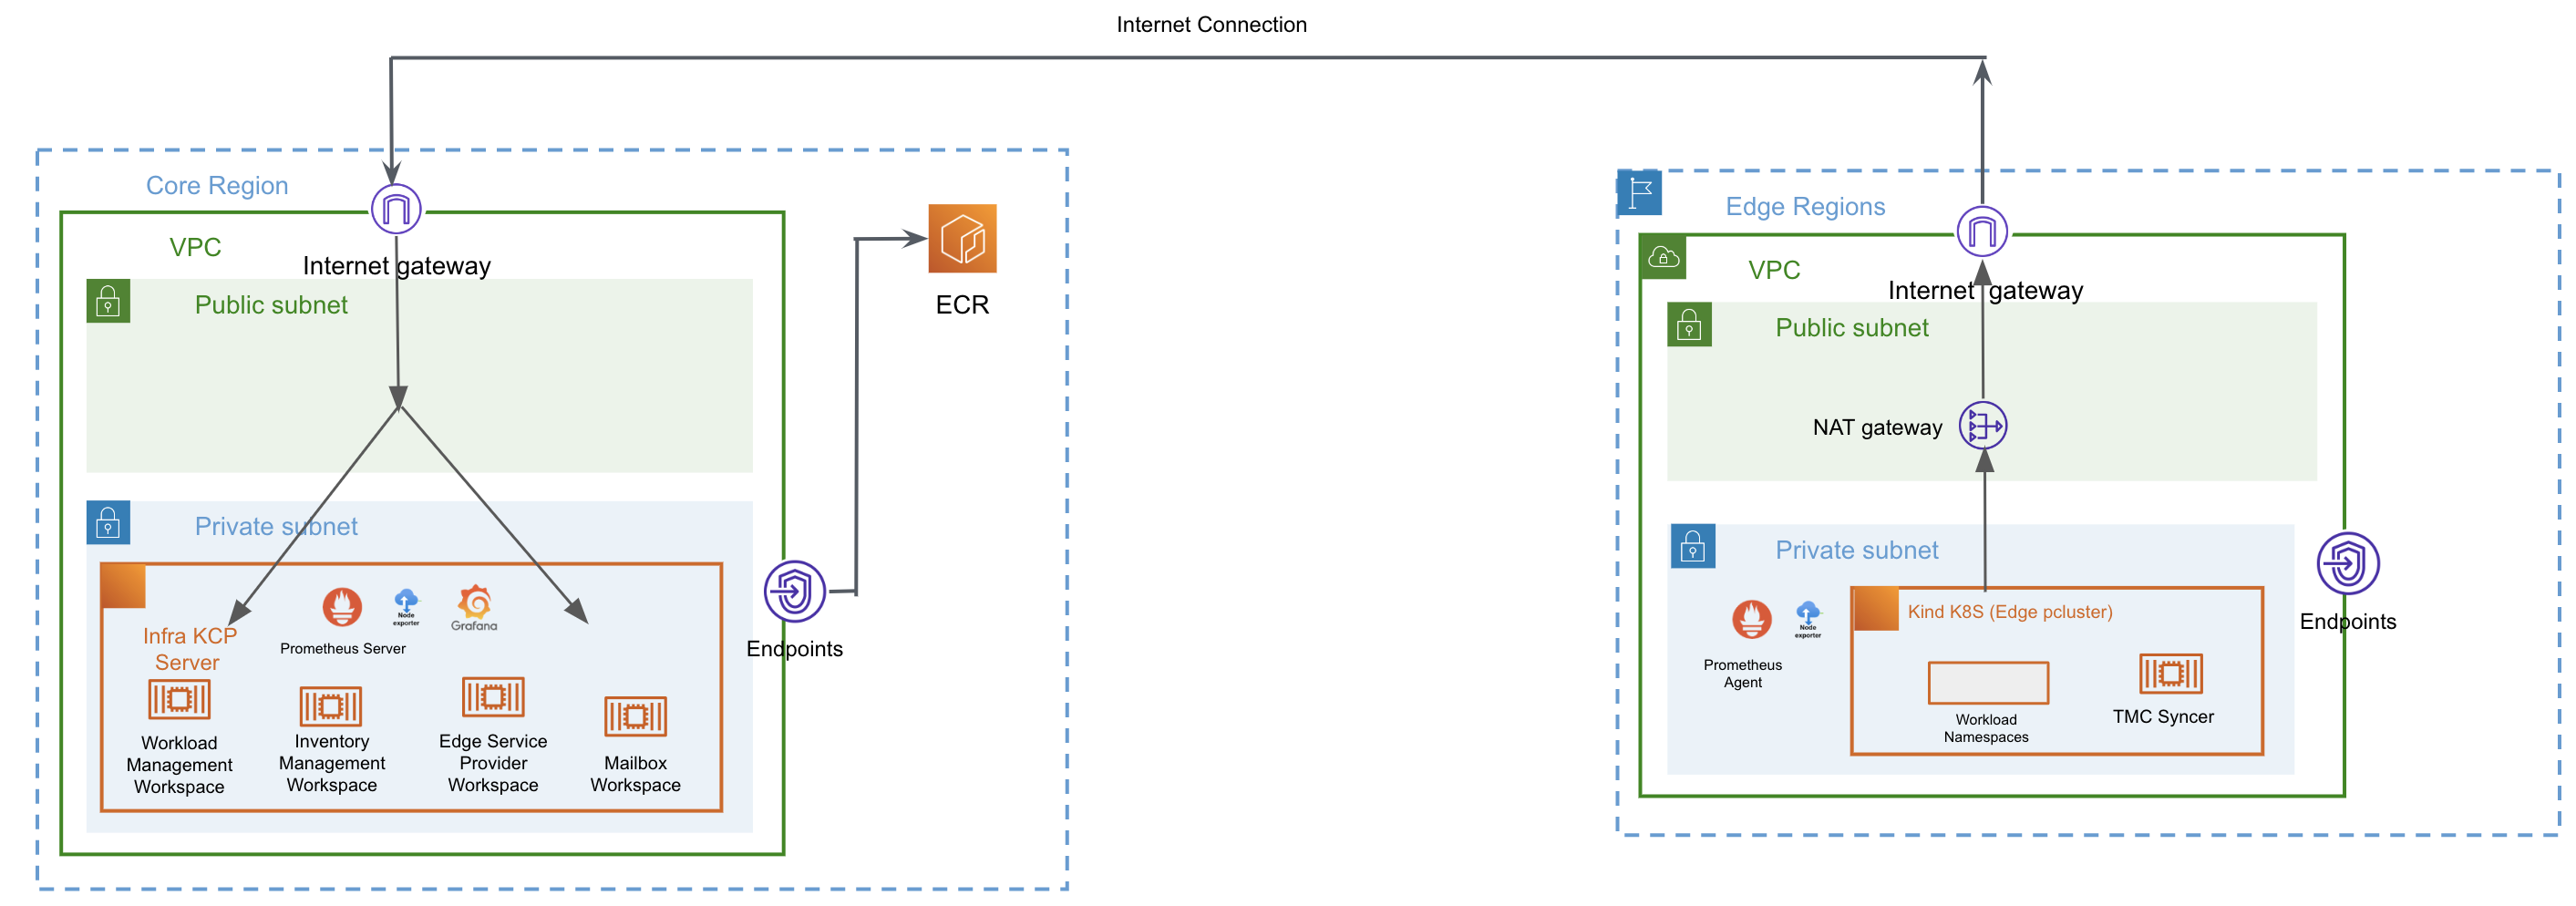
This example shows how to deploy monitoring tools (prometheus, grafana and node exporter) for KubeStellar components (core and edge regions) - see architecture image above. Prometheus server is deployed in the core region running the KCP server alongside the components for KubeStellar. A Prometheus agent is deployed in the edge regions running the workload execution clusters.
- Create your hosts file with the list of target hosts (KCP server & workload execution cluster)
- Configure the prometheus targets endpoints:
a) Prometheus Server: edit the file roles/prometheus/templates/prometheus-config.yaml.j2
global:
  evaluation_interval: 5s
  external_labels:
    env: dev
  scrape_interval: 30s
scrape_configs:
- job_name: mailbox-controller
  scrape_interval: 15s
  metrics_path: /metrics
  static_configs:
  - targets:
    - '<host-ipAddress>:10203'

- job_name: node-exporter
  scrape_interval: 15s
  metrics_path: /metrics
  static_configs:
  - targets:
    - '<host-ipAddress>:9100'

- job_name: kcp
  scrape_interval: 15s
  scheme: https
  metrics_path: /metrics
  tls_config:
    insecure_skip_verify: true
  static_configs:
  - targets:
    - '<host-ipAddress>:6443'
b) Prometheus Agent: edit the file roles/prometheus/templates/prometheus-agent-config.yaml.j2
# my global config
global:
  scrape_interval: 15s
  evaluation_interval: 15s
scrape_configs:
  - job_name: "prometheus-agent"

    static_configs:
      - targets: ["{ ansible_default_ipv4.address }:<port_number>"]
remote_write:
  - url: "http://<prometheus-server-ip-address>:<port_number>/api/v1/write"
- Install prometheus server, grafana and node exporter to the KCP server host using the following playbook:
- hosts: kcp-server
  remote_user: ubuntu
  become: yes
  gather_facts: yes
  connection: ssh
  tasks:
  roles:
    - node-exporter
    - prometheus
    - grafana
- Install prometheus agent and node exporter to a workload execution cluster using the following playbook: